
The weekly housing trends ending August 16,2025, show very little movement in the market with steady prices and longer days on the market. New listings have increased ad active inventory has increased by nearly 21% year over year.
What this week’s data shows
Even though mortgage rates have eased in recent weeks, the housing market continues to see little movement, with steady prices and longer days on the market. With 81% of homeowners holding mortgages below 6% and over half below 4%, both sellers and buyers have a strong incentive to stay put. Without a meaningful drop in rates, the market is likely to remain slow, with limited selling and buying activity.
Weekly housing trends highlights
- New listings—a measure of sellers putting homes up for sale—rose 4.9% year over year
New listings rose 4.9% last week compared with the same period last year, a lower rate compared with the previous week, as the number of new listings remains below the spring and early summer norm. Homeowners are showing less urgency to list, as rising inventory and cautious buyer activity continue to temper the market. - Active inventory climbed 20.9% year over year
The number of homes active on the market climbed 20.9% year over year, easing slightly compared with the previous week for the ninth consecutive week. Nevertheless, last week was the 93rd consecutive week of annual gains in inventory. There were roughly 1.1 million homes for sale last week, marking the 16th week in a row over the million-listing threshold. Active inventory is growing significantly faster than new listings, an indication that more homes are sitting on the market for longer. - Homes spent 7 days longer on the market than a year ago
The pace of home sales has been sluggish this summer as still-high housing costs and general economic uncertainty deterred would-be buyers. Facing dwindling buyer interest, many sellers are adjusting course, lowering prices or rethinking whether to sell at all. Sellers’ adjustment to today’s market is clear in climbing price reductions and delistings this summer. - The median listing price was flat year over year
The median list price was flat compared with the same week in 2024. The median list price per square foot, which accounts for changes in home size, rose 0.1% year over year, extending its nearly two-year growth streak, though this represents the slowest growth rate over that period.
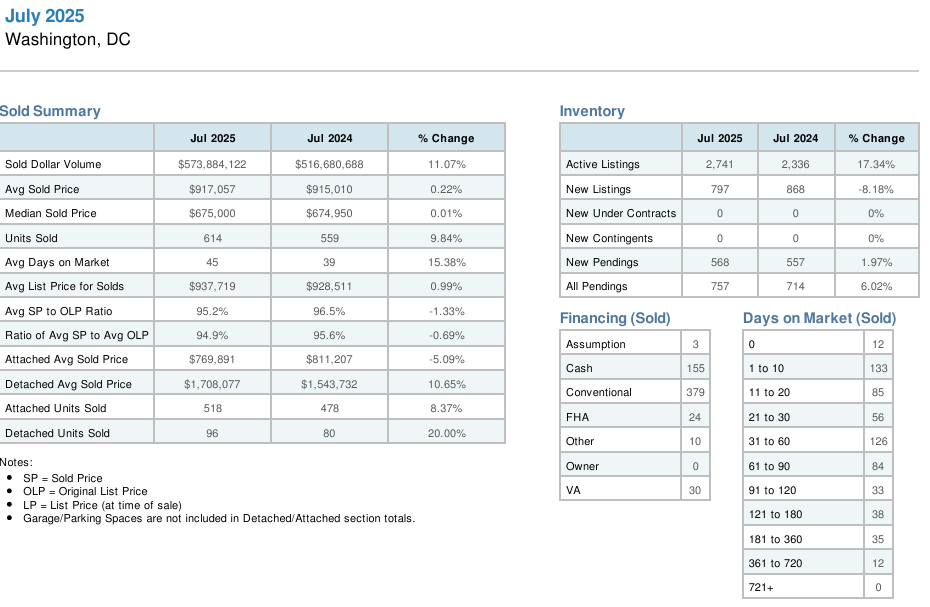
July Housing Trends Highlights for Washington DC
Unlike the national statistics, DC has seen the number of active listings decline when compared with last year while the number of pending listings has increased. The days on market, like the national trends, have increased by 15% from 39 days in 2024 to 45 days in July 2025, but the average sale price has remained steady, and the total sales volume has gone up by 11%. While the DC condo market is very slow right now, the overall DC market is strong for sellers.
July Housing Trends Highlights for Montgomery County
All real estate is local, so you might be curious how Montgomery County in July compared with the most recent national report. Here is a chart which shows that prices in Montgomery County in July were essentially flat year over year, but the total number of active listings has increased by 65% over last July. Similarly, the days on market has gone up by nearly 30%. Some sellers are reducing their listing price while others are taking their homes off the market completely.
